Op deze web-site wil Staffjoy's Staffordshire Bull Terriers graag haar honden presenteren maar tevens informatie gegeven met betrekking tot het geweldige ras, de Staffordshire Bull Terrier. U zult informatie aantreffen over het karakter van de Staffordshire Bull Terrier, opvoedingstips, informatie over het bezoeken van een tentoonstelling, maar ook de verzorging van een Staffordshire Bull Terrier wordt behandeld. Wij zullen proberen deze web-site goed te "onderhouden" en regelmatig van nieuwe artikelen te voorzien - een bezoekje zal daarom altijd de moeite waard zijn. Wij wensen u veel lees- en kijkplezier op deze website!
Met hartelijke Staffordgroet,
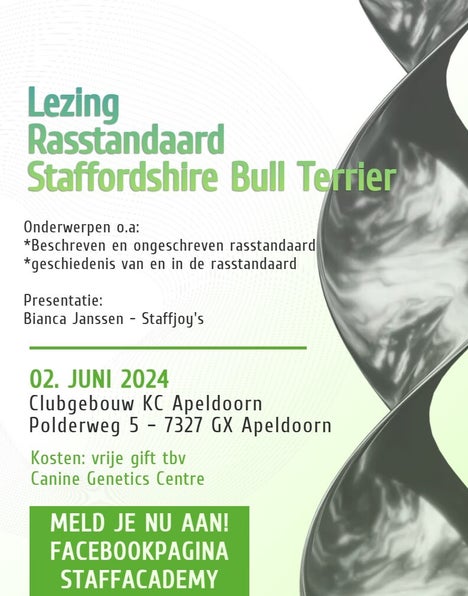
Henk & Bianca Janssen